
Despite a very bumpy ride, the capital markets posted strong gains in the first quarter of 2023. The broad fixed income market (BB US Agg) returned 3.0% in the quarter as rates declined across the maturity spectrum. The index is down 4.8% for the year. The US large cap market (S&P 500) rallied at end of March to finish the quarter up 7.5%, cutting the one-year loss to 7.7%. In a huge reversal from 2022, growth stocks outperformed value stocks in the quarter (returning 14.4% versus 1.0%), although value stocks are ahead by 5.0% over the last year. US small- and mid-cap stocks struggled significantly in March and their relative outperformance to large caps for the three- and twelve-month periods has now been erased. International developed equities posted strong gains in the quarter and continue to outperform their US counterparts over the trailing year. Emerging market stocks, on the other hand, underperformed US large caps by over 2.5% for the quarter and are down 10.7% for the year. Mainland Chinese stocks returned 4.7% in the quarter, while Latin American stocks returned 3.9%. The US dollar (US Dollar Index) declined against most other currencies (-1.3%) in the quarter and is now up only 3.2% over the previous twelve months.
Given the strong capital market returns in the quarter, all of the Core Satellite portfolios posted positive returns. On a relative basis, the Global strategies performed similarly to their benchmarks while the Select strategies outperformed by 1-1.5%. For the trailing year, the Global strategies modestly underperformed while the Select strategies modestly outperformed.
The “Core” portion of the Global strategies underperformed the MSCI World Index in the quarter due to weak relative performance coming from BLES (5.1%), WWJD (6.2%), FDLS (3.3%), and BIBL (5.3%) versus 7.7% for the MSCI World. The “Core” portion of the Select strategies performed in line with the MSCI World Index for the quarter. The “Satellite” portion of the strategies outperformed as most of the sectors we held over the course of the quarter (see below) outperformed the MSCI World Index, especially the consumer discretionary and technology sectors that were held for most of the quarter. On the fixed income side, the bond portion of the 70/30 strategies underperformed the BC US Agg in the quarter given IBD’s shorter duration (4.1 versus 6.8 years) as interest rates declined. For the year, IBD has outperformed the BB US Agg by over 2.0% as rates increased significantly over the period.
Satellite Strategies Held During Quarter

As mentioned in last month’s commentary, indeed some winds of change began sweeping through the markets near the end of March. Core Satellite models had benefited earlier in the month and for much of the year by our overweight satellite positions in technology and consumer discretionary sectors, but those trends seem to have run their course for the time being and with relative strength and momentum signals weakening in those sectors we have rotated into the healthcare and consumer staples sectors, which are showing relative strength and momentum signals on the upswing.
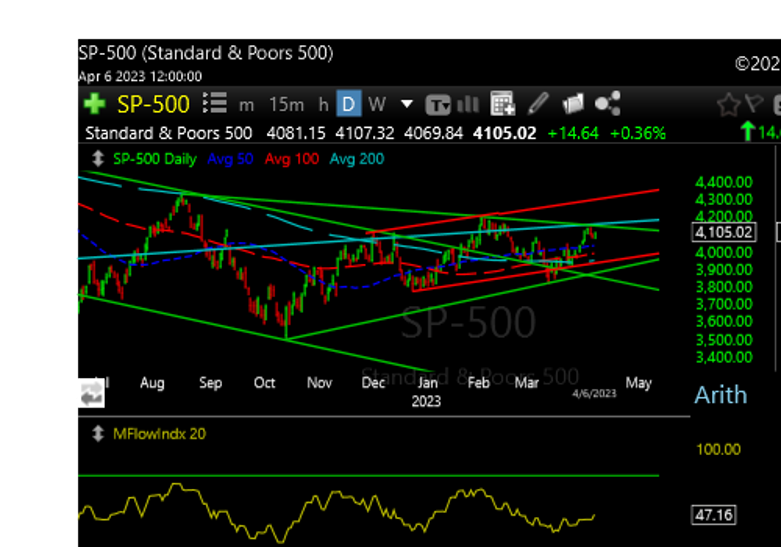
The stock market, as well as bonds and other markets, are still in a transition period that could eventually break in either direction, and might be a bit volatile as the tug of war between bulls and bears plays itself out for who gets to lead the next trend direction. There does seem to be a strengthening probability that the next large move in stocks could be down, possibly a rather intense move down, so this is a time for a healthy dose of caution for investors. You can see a clear horizontal wedge pattern developed in the S&P 500 price chart (below), which typically is a continuation pattern of the previous trend – which in this case was the sharp losses of 2022. There are enough touch points on this wedge to count it complete, so we will continue to watch the charts carefully for confirmation that our sector bets are appropriate as the next directional trend emerges, whichever direction that may be.

Last month I wrote about the tenuous situation of the stock market and that risk levels were on the verge of registering undesirable levels for our conservatively-minded Tactical Risk Management strategy. Those risk levels did in fact continue to elevate, triggering the TRM strategy to move back into a defensive posture late in the month.
There were a handful of positive days for the stock market at the end of March, and as TRM was out of stocks and fully allocated to investment grade corporate bonds at that time, the TRM strategies underperformed benchmarks for the month. However, it does not seem likely that those few days of positive returns will last very long and could soon be eroded by a new downtrend which seems to be forthcoming, allowing TRM to catch up and quite possibly surpass benchmarks in April.
I want to highlight that should the next leg down in the stock market materialize, as our TRM research suggests is a more likely outcome, that according to Elliott Wave analysis it should be a significant move lower, being in the third wave of a larger third wave position. This amount of potential bearish energy needs to be respected, and it is our opinion that due to the potential depth and intensity of the bearish scenario, that investors are wise to tread lightly. Initial estimates based on the current chart patterns indicate that a 10% drop is likely, with a drop of more than 20% possible before the market finds it’s footing and is able to mount a noteworthy rally.
You can see a clearly defined horizontal wedge pattern in the S&P 500 price chart (below), which is typically a continuation pattern of the previous trend – which in this case was the blistering declines of 2022. This wedge pattern also fits neatly within the broader Elliott Wave structure, fitting the wave counts and pattern for a second wave of a five wave trend, again suggesting that wave three down is on deck.
That said, the markets are still in a transitional zone and there is not a clear trend at the moment, but that situation is likely to resolve soon and we will see which direction the stock market decides to break – higher or lower. We will continue to watch the price action and technicals closely to determine risk levels and confirm whether our current defensive footing remains appropriate.

At Inspire Advisors – The Chandler Team, we focus on three main strategies that are diversified and actively managed “in house” by The Chandler Team. Below is an overview of how the strategies performed, what changes were made during the month, and what our expectations are for the month ahead.
For the month of March, GLRY retracted -0.81% vs. S&P MidCap 400 (MDY) -3.18% and USA Momentum (MTUM) +0.44%. This was after a hard reversal from losses in the middle of the month. Versus the broad index, GLRY was in a much better position within financials, industrials, and information technology, and energy and health care were minor headwinds. Versus the momentum index, the underperformance primarily came from sector weights, with materials being the laggard. Notably, materials was also the best sector for active selection performance.
March 2023 will turn into a case study for future academics after the fastest bank run and the second largest bank failure in US history. These events don’t bode well for our reduced volatility outlook at face value, but we see this as a chess move to have stability return to markets (more “London System” and less “Scholar’s Mate”). Rather than kicking the can further and further, letting anxiety build, lawmakers and market participants can more properly adjust course and reprice risk. That’s why our FEVRR method continues seeking good relative risk to reward (our last “R”).
April should be another interesting month for markets, as earnings season kicks off. Through it all though, don’t forget to pause for what matters. He is Risen!
We attribute this performance to the more conservative allocation that the fund held for the month with regard to the percentage of stock compared to treasuries and other protective asset classes. The main drag on the performance for the month was the underperformance of the filtered stocks (Inspire 100 Index) held within the fund for the month. This index lagged the broader stock market (S&P 500) by -3.90%, so although we only held approx. 40-50% stock allocation, those stocks underperformed the broader benchmark for the period.
The fund had done a good job of minimizing overall volatility measured by standard deviation; however, that volatility reduction has come at a cost as our conservative stock position has limited the performance in periods where the stock market stages a recovery as it has from March 22nd until the end of the month, increasing almost 5%. Additionally, since the stocks that we hold are currently based on the Inspire 100 Index, the underperformance of the Inspire 100 compared to the S&P 500 has added to the underperformance compared to the benchmark.
We also held a portion of US Treasuries (long and intermediate-term) at the beginning of 2022, but due to rising interest rates, their price decline added to the underperformance even though our overall allocation to stocks was at its lowest since the inception of the fund, the alternative asset classes did not give us a boost as all correlations went to 1 on the downside in 2022.


Information on this website does not involve the rendering of personalized investment advice but is limited to the dissemination of general information on products and services. A professional adviser should be consulted before implementing any of the options presented. The information presented is believed to be factual and up-to-date, but we do not guarantee its accuracy and it should not be regarded as a complete analysis of the subjects discussed.
The firm only transacts business in states where it is properly registered or is excluded or exempted from registration requirements. Registration as an investment advisor does not constitute an endorsement of the firm by securities regulators nor does it indicate that the advisor has attained a particular level of skill or ability.
Different types of investment involve varying degrees of risk, and there can be no assurance that any specific investment will either be suitable or profitable for a client's investment portfolio. No client or prospective client should assume that any information presented and/or made available on this Website serves as the receipt of, or a substitute for, personalized individual advice from the adviser or any other investment professional.
National Admin Office: 3597 E Monarch Sky Ln, Suite 330 Meridian, ID 83646; Phone: (877) 859-6383 Investment advisory services offered through Inspire Advisors, LLC, a Registered Investment Advisor registered with the SEC.
© Copyright - Inspire Advisors, LLC
